New system ranks districts on variety of components
Published 8:46 am Sunday, August 25, 2013
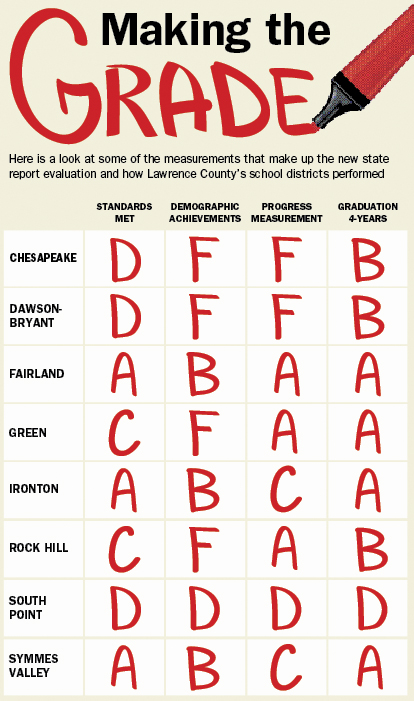
This is a look at some of the measurements that make up the new state report evaluation and how Lawrence County’s school districts performed
A new way of judging state schools has educators, parents and students wondering what it all means.
In years past deciding if schools were providing quality education was determined a great deal by taking the state test scores and turning them into percentage grades for reading, writing, science and math. These indicators are still being used to judge schools where 75 percent of the students have to score proficient or better to reach an indicator.
However the new system has gone to letter grades to measure standards met, progress, graduation and demographic achievement. Then those components have been subdivided into nine categories.
The achievement score — or standards met — is made up of performance indicators and performance index. These indicators show the number of students who have a basic level of knowledge and are based on the 24 state tests.
Proficiency still remains at a 75 percent score of students hitting the indicators. However, next year that percentage jumps to 80 percent.
Also part of that score is the performance index that measures every student, whether they are proficient or not. A better performance means more points for the school for the index.
The progress component measures in four ways — all students, gifted students, those with disabilities and those in the lowest 20 percent of achievement. The goal of this component is to make sure every student is excelling academically.
Graduation rate measures the number of students who take four and five years to complete their high school curricula starting in ninth grade.
The gap-closing component, or demographic achievement, is made up of the annual measurable objectives, or AMOs, that look at the performance of students by looking at demographics. The performance of a specific group is measured against that of the whole student body. Those groups are American Indian/Alaskan Native; Asian/Pacific Islander; Black, non-Hispanic; Multiracial; White, non-Hispanic, economically disadvantaged; students with disabilities and students with limited English proficiency.
To get the top grade in this category all groups, if applicable, must be reached. No district in the county got an A on its demographic achievement or AMO. However, both Fairland and Ironton received a B.
FAIRLAND
Of the seven districts Fairland pulled in the most top grades, receiving four As and five Bs. The top grades were received for four-year graduation rate, progress measurement for all and gifted students, and standard indicators with 23 out of 24 met.
“Our teachers and principals have worked very hard over the past couple of years refining the curriculum and making improvements for our students,” Superintendent Roni Hayes said via email. “We are committed to the children in our district and will continue to make the educational experience better for them. The dedication of students, parents, faculty and staff is apparent in all that we do, but what makes me most proud is the fact that we have people in our district that truly care about the we being of a child.”
CHESAPEAKE
The highest grade received by the Chesapeake district was a B for the four-year graduation rate. The next highest grades were two Cs received for the standards met index and five-year graduation rate.
The district received five Fs, the highest number of failing grades in any of the districts. They were in progress measurement for all, progress for gifted and progress for disabled and progress for lowest 20 percent and demographic achievement. Chesapeake met 16 of the 24 indicators.
“We are not happy with our report card,” Superintendent Jerry McConnell, said. “Our goal is to educate each student to the best of his or her ability. We have a very well-trained staff. Our students are more than cooperative as are their parents. We are in the middle of evaluating it and how our scores turned out to be lower than we expected. “This is new to all of us. Our goal is not so much we have a great report card but to educate all of students to the best of our ability. We hope that will turn out to be a good report. We are now evaluating what is taking place and see what changes we can make in the curriculum so we can accomplish a better report card.”
SOUTH POINT
The South Point district met 16 of its 24 indicators and received three failing grades in progress measurement for disabled, progress for lowest 20 percent and five-year graduation rate.
The top grade the district pulled in was a B for progress measurement for gifted students. The next best score was for performance or standards index with a C grade. Three Ds were made in progress measurement for all students; demographic achievement and standards met.
“It is really ironic. We missed one indicator by one kid in 11th grade math and two others by two kids each,” Superintendent Mark Christian said. “One kid would have made us go from a D to a C in the indicator category. We did really well with our gifted kids. Our special ed population always seems to be a trouble to close the gaps. That is a struggle with everybody. We are not making any excuses. We need to work harder. We will try to focus on specific areas. In the past, we have had a blanket approach, not targeting a specific area. We will try to have a more focused, targeted approach and fix what is broken.”
DAWSON-BRYANT
Dawson-Bryant schools received an overall grade of D for number of standards met, meeting 14 out of 24 performance indicators.
“We have a lot of work to do, pure and simple,” George York, Dawson-Bryant superintendent, said. “It’s not a quick fix. It’s a systemic situation for sure.”
The district received a letter grade of C for the overall performance index, which measures the achievement of every student, not just those who reach “proficient.”
“We are going to look at this with a wide-open lens,” York said. “We need to use our resources better and provide better training for teachers.”
As for the progress component, the district received a grade of F for progress for all students and a C for students with disabilities. A grade of D was given for the district’s students in the lowest 20 percent achievement.
Dawson-Bryant got no grade for gifted students value-added.
For the demographic achievements, Dawson-Bryant received a grade of F in the category.
Dawson-Bryant got two Bs on the report card, one each for its four-year and five-year graduation rates.
“We are going to attack these issues aggressively,” York said. “We have a great staff and great kids. I haven’t had time to really dig deep into the data, but our goal is to move forward and improve while doing so.”
ROCK HILL
The Rock Hill Local Schools District received an overall letter grade of C for standards met and a C for performance index. Rock Hill met 17 of the indicators.
The district’s lone A was given for progress for all students and a C was given in both progress for gifted students and those in the lowest 20 percent.
Rock Hill was given two F grades, one for progress for achievement for disabled students and one for demographic achievement.
The district’s four-year graduation rate was given a B and five-year graduation rate was given a D.
Superintendent Wes Hairston was not available for comment.
SYMMES VALLEY
Symmes Valley Local garnered three A grades, one in standards met, one for progress for students with disabilities and one for its four-year graduation rate. The district met 23 of the 24 indicators.
The lowest grades given to the district were two Cs, one for progress for all students and for gifted students.
Four grades of B, round out the Vikings report card, one each in performance index, for students in the lowest 20 percent, demographic achievement and five-year graduation rate.
Superintendent Jeff Saunders was not available for comment.
COLLINS CAREER CENTER
Collins Career Center was given grades for three components: four-year and five-year graduation rates and post-program outcomes.
The school received an A, B and D, respectively, for those components.
Superintendent Steve Dodgion was unavailable for comment.
IRONTON
The Ironton City Schools District received top marks for meeting 22 out of 24 performance standards, earning a letter grade of A.
Dean Nance, superintendent, said he was proud of his staff and students who worked hard to meet those standards.
“I was happy with the performance indicators that Ironton City Schools received this year,” Nance said. “We increased from last year. We’ve consistently been increasing.”
Nance said the ODE launched simulated report cards with the new grading scale last year and that Ironton improved by 59 percent in the nine standards the report measures.
This year, the district also received an A for the four-year graduation rate class of 2012. The five-year graduation rate received a B.
For the progress of all students, gifted students and the lowest 20 percent in achievement, the district received C ratings. The progress for students with disabilities earned a B.
Demographic achievement for the district earned a B.
Despite the seemingly cut and dry letter grading system the Ohio Department of Education rolled out this year, Nance said he didn’t think the new system would be easily understood by parents.
“I don’t believe that it is easily understandable by parents and the public,” Nance said. “I don’t think it’s necessarily fair. I believe the way it’s set up, I believe it degrades the achievement of the public school. And I don’t think they care that it does.”
Nance said he attended a rollout session for the new report card and he, as well as other superintendents across the state, expressed their concerns for the new system.
“They tried to tell us a C meant you were doing an adequate job,” Nance said. “I tried to explain to them, along with other superintendents around the state, that in most people’s minds, a C is not acceptable. I think a lot of it is going to be educating the community and educating the citizens of the school district as to what this really means.”
Nance said the district would continue to prepare its students for testing, regardless of changes in the report cards.
“All I can say is, it is not changing what we’ve been doing for the past couple of years in terms of preparing students,” Nance said. “We have been doing quarterly assessments and analyzing student data and trying to raise the level of achievement and providing differentiated instruction. That, we will continue to do.”
GREEN
Green Local Schools in Scioto County met 17 of 24 standards, earning the district a C rating for that component. The district earned three As in the areas of progress for all students, four-year graduation rate and five-year graduation rate.
The district received F grades in progress of disabled students, progress of lowest 20 percent in achievement and demographic achievement.
A B was earned for the progress of gifted students.
A voicemail for Superintended Sandy Mers was not returned by press time.
More Chesapeake


-
Polls
 Loading ...
-
-